

Contents
- Quick Answer
- What Is the E-2 Visa Approval Rate in 2026?
- How Has the E-2 Approval Rate Changed Year Over Year?
- What Counts as a Refusal in This Data?
- How Does the E-2 Compare With Other Business Visas?
- Which Countries Received the Most E-2 Visas in FY2024?
- What Does the Data Mean for Canadian Investors?
- Why Do E-2 Applications Get Refused?
- How Can You Strengthen an E-2 Application?
- Frequently Asked Questions
- Conclusion
- How Mayo Law Can Help
- Disclaimer
How likely is an E-2 application to succeed? The E-2 visa approval rate at U.S. consular posts worked out to 90.1 percent in fiscal year 2024, the most recent full year of official State Department workload data. Consulates issued 55,324 E-2 treaty investor visas that year and refused 6,108 applications. Those two numbers, published in the Department’s Worldwide NIV Workload by Visa Category table, are the closest thing to an official answer that exists.
This guide walks through the verified numbers: how the rate has moved since FY2019, how the E-2 compares with other business visas, which nationalities use the program most, where Canada fits, and what the data does and does not tell you about your own application. Every figure below was checked against travel.state.gov, uscis.gov, or the Code of Federal Regulations in July 2026, and the sources are linked throughout.
Quick Answer
In fiscal year 2024, U.S. consulates issued 55,324 E-2 visas and refused 6,108 applications, an issued share of 90.1 percent. The State Department does not publish an official approval rate. That figure is calculated from its FY2024 worldwide workload table, and it excludes change-of-status cases decided by USCIS inside the United States.
What Is the E-2 Visa Approval Rate in 2026?
As of July 2026, the most recent full fiscal year with published issuance and refusal data is FY2024, which ran from October 2023 through September 2024. The State Department’s Worldwide NIV Workload by Visa Category table records 55,324 E-2 visas issued and 6,108 applications refused, for a total of 61,432 applications adjudicated at consular posts worldwide. Dividing issuances by total applications gives an issued share of 90.1 percent.
One nuance matters before you quote that number anywhere. The State Department does not publish a statistic labeled approval rate for the E-2 program. Its table reports raw issuance and refusal counts, and every percentage you see quoted online, including the one in this article, is calculated from those counts. When a website cites a precise E-2 visa approval rate without naming the underlying table, it is worth asking where the number came from.
The FY2024 result is not an outlier. Since FY2019, the issued share has stayed inside a band running from roughly 88 percent to 92.5 percent, through a pandemic, a consular shutdown, and a record-setting recovery.
How Has the E-2 Approval Rate Changed Year Over Year?
The table below is built from the State Department’s annual workload files for each fiscal year. The issued share is calculated as issuances divided by issuances plus refusals.
| Fiscal year | Issued | Refused | Total applications | Issued share |
|---|---|---|---|---|
| FY2019 | 43,286 | 5,115 | 48,401 | 89.4% |
| FY2020 (preliminary) | 23,493 | 3,266 | 26,759 | 87.8% |
| FY2021 | 33,129 | 2,683 | 35,812 | 92.5% |
| FY2022 | 45,878 | 4,823 | 50,701 | 90.5% |
| FY2023 | 54,812 | 5,615 | 60,427 | 90.7% |
| FY2024 | 55,324 | 6,108 | 61,432 | 90.1% |
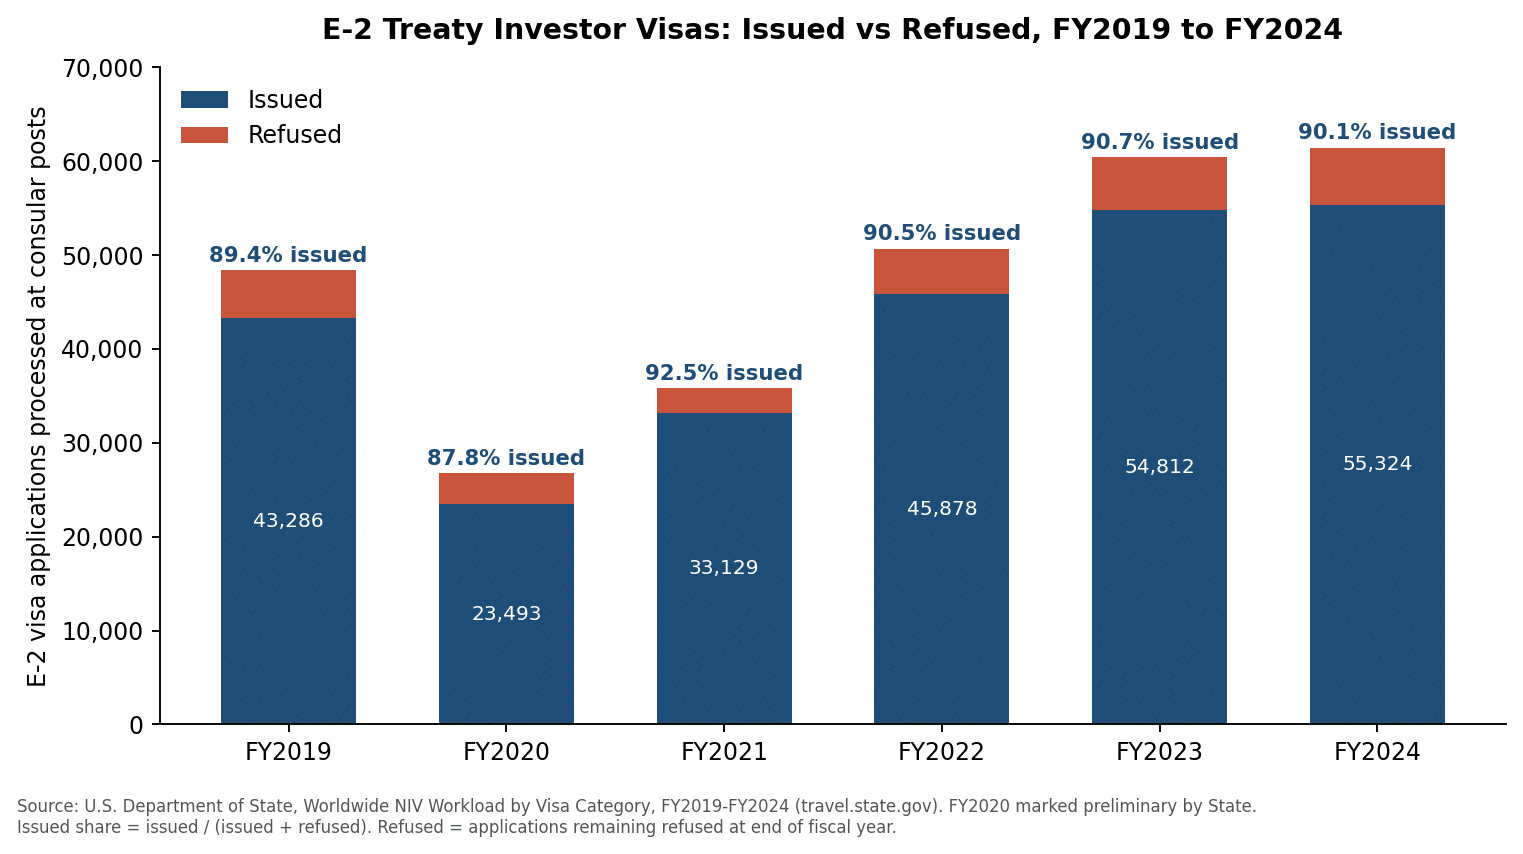
The volume story is more dramatic than the rate story. Issuances collapsed to 23,493 in FY2020 when consular operations shut down, rebuilt through FY2021 and FY2022, and then set consecutive records in FY2023 (54,812) and FY2024 (55,324), the highest annual totals in the published workload series reviewed here, which covers FY2018 through FY2024. Through all of that movement, the refusal share stayed between about 7.5 and 12 percent. The State Department still marks the FY2020 file as preliminary data subject to change.
A caution about older statistics: figures from before FY2019 are not comparable. The FY2018 table reported 41,181 E-2 issuances against 13,489 refusals, but it also reported 8,647 refusals that were waived or overcome, and its footnote states that a visa may be refused in one fiscal year and the refusal overcome in a subsequent fiscal year. Beginning with FY2019, the published tables count only applications that remained refused at the end of the fiscal year. A pre-2019 refusal rate quoted next to a modern one overstates how much the program has changed.
What Counts as a Refusal in This Data?
The workload tables carry a one-line definition that does a lot of work. In the Department’s words, the refused totals reflect applications that remained in a refused status at the end of the reporting period. A refusal in this dataset is a point-in-time status, not always a final outcome. An applicant refused for missing documents in June who cures the problem in the same fiscal year can end the year as an issuance rather than a refusal, and a refusal recorded in one year can be overcome in the next.
Just as important is what the tables leave out. They cover visa applications decided at U.S. embassies and consulates abroad, and nothing else. An investor who is already in the United States in another lawful status can instead ask USCIS to change status to E-2 by filing Form I-129, and USCIS decides those cases domestically under the same substantive rules. USCIS guidance is explicit that an I-129 request cannot be made from outside the country. None of those USCIS adjudications appear in the consular workload numbers.
The practical consequence: there is no single published number that captures the odds of ultimately winning E-2 status across both pipelines. What the official data supports saying is narrower and still useful. Of the E-2 applications adjudicated at consular posts in FY2024, 90.1 percent ended the year issued.
How Does the E-2 Compare With Other Business Visas?
Putting the E-2 next to other work categories from the same FY2024 table shows a pattern that surprises many applicants.
| Category (FY2024) | Issued | Refused | Issued share |
|---|---|---|---|
| H-1B (petition-based) | 219,659 | 6,298 | 97.2% |
| L-1 (petition-based) | 71,799 | 2,914 | 96.1% |
| O-1 (petition-based) | 19,457 | 1,212 | 94.1% |
| E-1 treaty trader | 5,639 | 502 | 91.8% |
| E-2 treaty investor | 55,324 | 6,108 | 90.1% |
| B-1/B-2 visitor | 6,498,006 | 2,497,104 | 72.2% |
| F-1 student | 400,737 | 278,553 | 59.0% |
| TN (see note) | 15,672 | 11,645 | 57.4% |
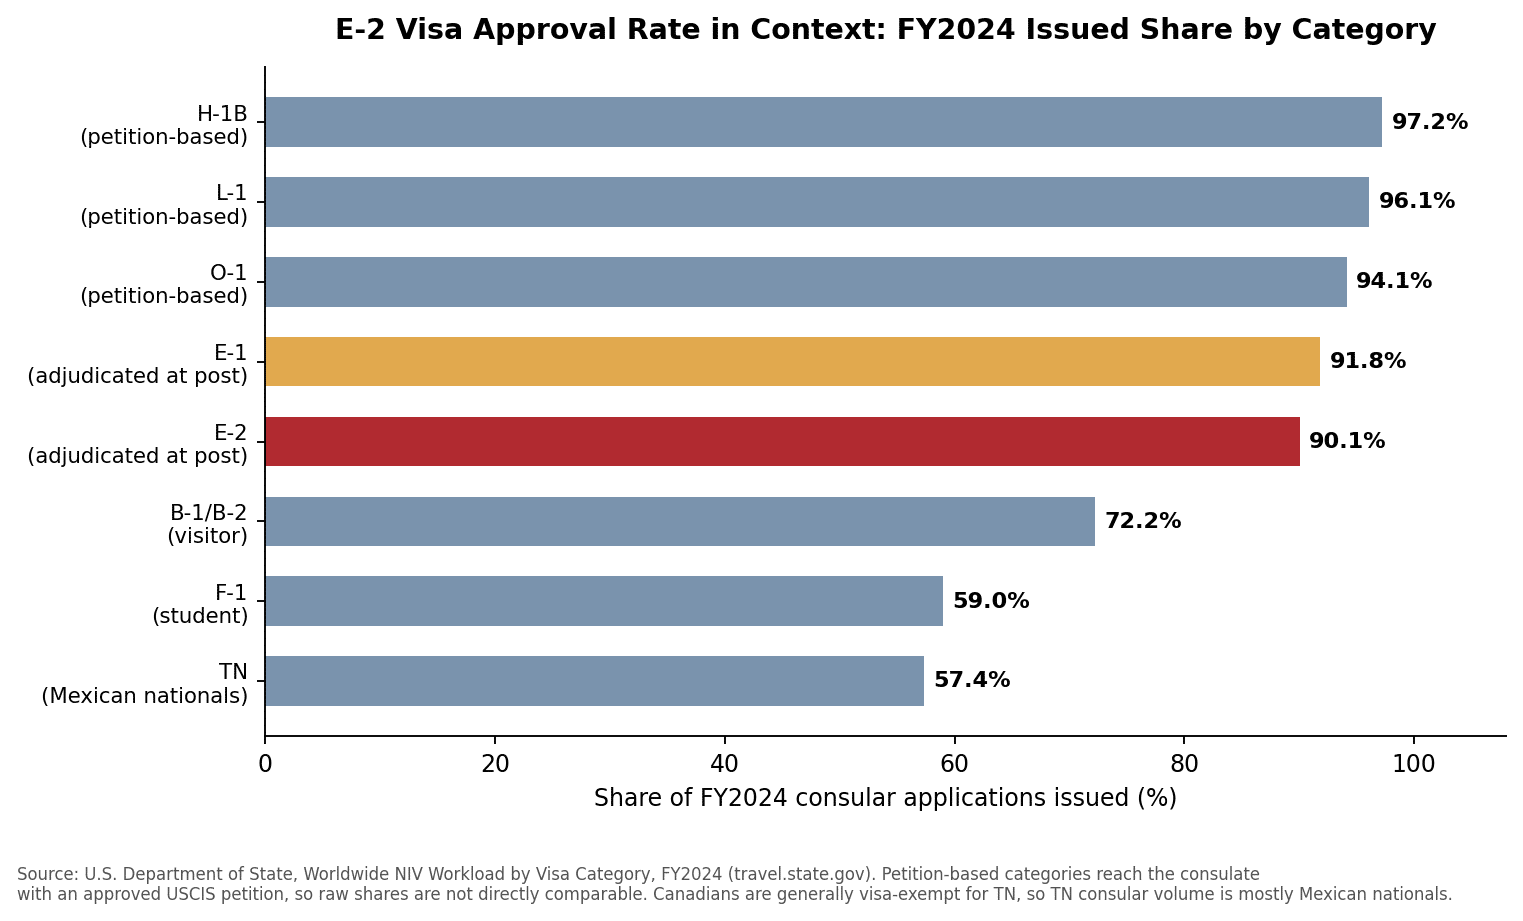
The higher shares for H-1B, L-1, and O-1 are not evidence that those visas are easier to get. They are petition-based categories: by the time an applicant reaches the consular window, USCIS has already approved a petition establishing eligibility, so the consular stage functions as a second-level review. The E-2 works differently for first-time consular applicants. The consular officer adjudicates the entire case, including the investment, the business, and the applicant’s role, without any prior USCIS approval. A 90.1 percent issued share under that kind of full first-instance review arguably says more about how well-prepared E-2 applicants are than a 97 percent share says about a pre-screened category.
The TN row is the clearest warning against reading this table casually. TN looks like the hardest category on the chart, at 57.4 percent. In reality, Canadian citizens generally do not need a TN visa at all, because they can apply for TN admission directly at the border. Consular TN applications therefore come overwhelmingly from Mexican nationals, and the low TN figure describes that applicant pool, not the difficulty Canadians face.
Which Countries Received the Most E-2 Visas in FY2024?
The State Department’s FY2024 NIV Detail Table breaks issuances out by nationality. Japan dominates with 15,521 E-2 visas, about 28 percent of the worldwide total. South Korea (6,778) and Canada (6,747) are effectively tied for second, separated by 31 issuances. Germany (3,902), France (3,574), Taiwan (2,921), the United Kingdom (2,720, listed in the table as Great Britain and Northern Ireland), Italy (1,531), Mexico (1,514), and Spain (1,438) round out the top ten.
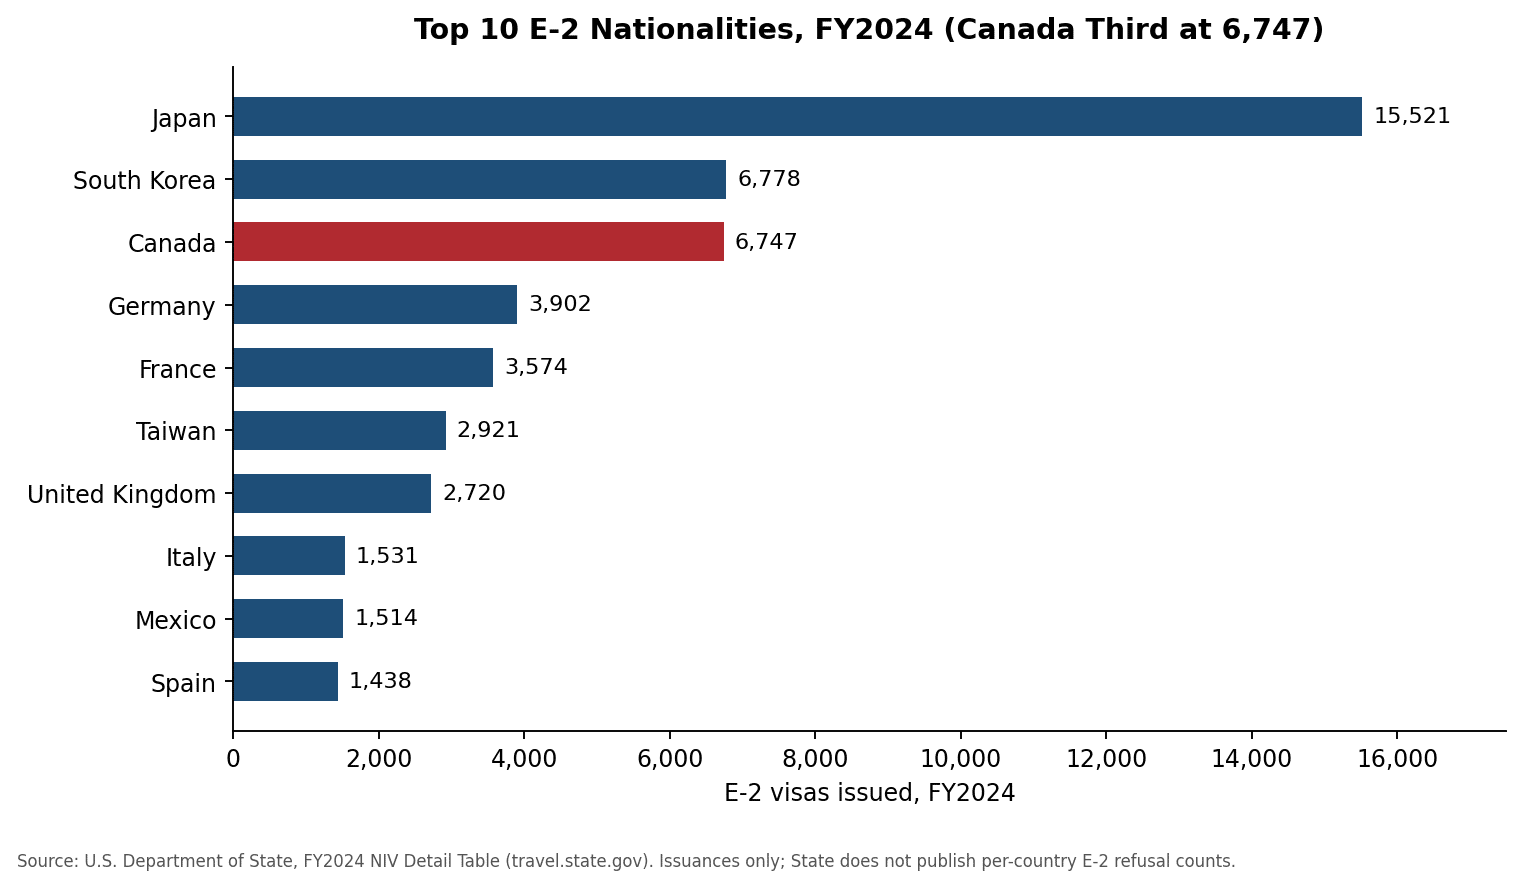
One limitation deserves emphasis. The detail table reports issuances by nationality only. The State Department does not publish per-country refusal counts for the E-2, so a per-country E-2 approval rate cannot be computed from public data. The only nationality-level refusal series the Department publishes is the adjusted refusal rate for B visitor visas, which tells you nothing about treaty investors.
What Does the Data Mean for Canadian Investors?
Canada appears on the State Department’s treaty countries list for both the E-1 treaty trader and E-2 treaty investor categories, with treaty status effective January 1, 1994, the date the trade agreement between the two countries entered into force.
Canadians face a wrinkle that surprises even experienced cross-border businesspeople. Under 8 CFR 212.1(a)(1), a visa is generally not required for Canadian citizens, except those falling under categories E, K, S, or V. A Canadian who can fly to New York visa-free for meetings, or take up TN professional status at the border with a job offer letter, still needs an actual E-2 visa issued by a U.S. consulate before running a business in treaty investor status. That is why Canada shows up fully in these consular statistics while barely registering in the TN visa numbers.
The FY2024 figures make the scale clear: 6,747 E-2 visas issued to Canadian nationals in a single year, more than Germany and France combined. For a Canadian founder or franchise buyer, the E-2 pathway typically runs through consular processing in Canada, layered on top of cross-border corporate, tax, and immigration planning. Our guide to the E-2 visa from Canada covers the Canadian-specific mechanics, and the E-2 visa requirements guide covers the substantive test every applicant must meet.
Why Do E-2 Applications Get Refused?
The workload tables count refusals without publishing reasons, so the honest way to answer this question is through the legal standard. The E-2 requirements sit in 8 CFR 214.2(e) and are summarized in USCIS’s E-2 Treaty Investors guidance. A refusal generally traces to one of these elements not being established on the record:
- Treaty nationality. The investor must be a national of a treaty country, and where the investor is a company, nationals of the treaty country must own at least half of it. Unclear dual-nationality or ownership documentation puts this element in doubt.
- Substantial investment. The regulations define substantial proportionally: the capital must be significant relative to the total cost of purchasing or establishing the specific business. The lower the total cost of the enterprise, the higher the proportion the investor must put in.
- A bona fide enterprise. The business must be a real, active, operating commercial undertaking producing goods or services for profit and meeting the legal requirements for doing business in its jurisdiction. Shell entities and passive holdings do not qualify.
- Marginality. Under 8 CFR 214.2(e)(15), an enterprise that lacks the present or future capacity to generate more than a minimal living for the investor and family is marginal and does not qualify, though a new business can satisfy the test by showing that capacity within five years of the investor’s E-2 start date.
- Develop and direct. The investor must be entering solely to develop and direct the enterprise, shown by at least 50 percent ownership or operational control through a managerial position or other corporate device.
How Can You Strengthen an E-2 Application?
The aggregate numbers cannot be broken out by preparation quality, but notice what the refusal grounds above have in common: every one of them is documentary. Treaty nationality is proven with corporate and citizenship records. Substantiality is proven with a transparent source-and-path-of-funds file and proof the money is committed and at risk, since USCIS requires the investor to have invested or to be actively in the process of investing. Marginality is answered with a business plan whose revenue and hiring projections a skeptical officer can test. Control is proven with the ownership and governance paper trail.
That is the practical takeaway from six years of stable data. The program approves roughly nine in ten consular applications, and the elements that sink the remaining tenth are the ones an applicant can address before filing rather than argue about afterward. A business plan built to the evidentiary standard, covered in our E-2 visa business plan requirements guide, and a complete application file, walked through in our E-2 visa application guide, are where that preparation shows up. Budgeting for the process is covered in our E-2 visa cost breakdown.
Frequently Asked Questions
What is the current E-2 visa approval rate?
U.S. consulates issued 90.1 percent of the E-2 applications they processed in fiscal year 2024: 55,324 issued against 6,108 refused, out of 61,432 total. That is the most recent full-year figure published by the State Department as of July 2026, and it is a calculated share rather than an official government statistic.
Does the U.S. government publish an official E-2 approval rate?
No. The State Department publishes issuance and refusal counts in its annual Worldwide NIV Workload by Visa Category table, and every approval-rate percentage you see, including the ones in this article, is calculated from those counts as issued divided by issued plus refused. USCIS change-of-status outcomes are tracked separately.
How many E-2 visas are issued each year?
Issuances reached 55,324 in FY2024 and 54,812 in FY2023, the two highest totals in the published workload series reviewed here. Earlier years came in at 45,878 (FY2022), 33,129 (FY2021), 23,493 (FY2020), and 43,286 (FY2019). The State Department still marks the pandemic-era FY2020 file as preliminary.
Is FY2025 E-2 data available yet?
Not as a full-year workload table. As of July 20, 2026, the State Department’s nonimmigrant visa statistics page lists FY2024 as the newest Worldwide NIV Workload by Visa Category file, and the newest Report of the Visa Office is the 2024 edition. Monthly issuance tables covering later months are published separately on the same site.
Where does Canada rank among E-2 countries?
Canada was the third-largest E-2 nationality in FY2024 with 6,747 visas issued, 31 behind South Korea and well ahead of Germany, France, and the United Kingdom. Canadian citizens need an actual E-2 visa from a U.S. consulate even though 8 CFR 212.1 makes them visa-exempt for most other nonimmigrant categories.
Does this data include change-of-status approvals inside the United States?
No. The workload tables cover only visa applications decided at U.S. embassies and consulates abroad. An investor already in the United States in lawful nonimmigrant status can instead ask USCIS to change status to E-2 by filing Form I-129, and those adjudications live in separate USCIS records that these consular tables do not capture.
Do E-2 approval rates vary by consulate or by country?
Possibly, but public data cannot prove it. The State Department publishes E-2 issuances by nationality with no per-country or per-post refusal counts for the category, so any per-country E-2 approval rate you encounter is an estimate. The only nationality-level refusal series it publishes is the adjusted refusal rate for B visitor visas.
Conclusion
The E-2 visa approval rate has held near 90 percent at consular posts every year since FY2019, through the largest demand swings in the program’s recent history, and FY2024 set the volume record at 55,324 issuances. The number is steady, but it is also frequently misquoted: it is a calculated share of consular outcomes, it excludes USCIS change-of-status cases, and it cannot be broken down by country or consulate from public data. Read any E-2 statistic, including this article’s, with the source table in hand. The applications that fail tend to fail on documentary elements that careful preparation can resolve before a consular officer ever sees the file.
How Mayo Law Can Help
Mayo Law is a cross-border business and immigration firm with offices in Toronto and New York. Principal attorney Joseph Mayo is licensed in both Ontario and New York, which matters for E-2 work because a Canadian investor’s application usually spans both legal systems at once: Canadian corporate structuring and funds documentation on one side, and U.S. immigration and business requirements on the other.
The firm assists treaty investors with entity structuring, source-and-path-of-funds documentation, business plans built to the regulatory standard, consular filings, and E-2 renewals, alongside the everyday legal needs of running a company on both sides of the border. If you are weighing an E-2 investment or preparing an application, our E-2 visa lawyer page explains how the firm works and how to book a consultation.
Disclaimer
This article is provided for general informational purposes only. It is not legal advice, it does not address the facts of any particular case, and reading it does not create an attorney-client relationship with Mayo Law or any of its lawyers. Government statistics, regulations, and agency guidance change; the figures above reflect official sources as accessed in July 2026 and are attributed where they appear. Mayo Law provides legal services in Ontario and New York. Attorney advertising. Consult a licensed attorney about your specific situation before acting.